The room already pulled. Career-stage matched, verified, reachable direct.
Which music data tools should A and R use, and what should they measure?
Music data tools for A and R are only as useful as the metrics you read in them. In 2026 the signals that matter are acceleration signals: short-form sound velocity over a 7 to 14 day window, save-to-stream ratio, and playlist add-rate, not raw follower counts. One affordable tracker such as Chartmetric or Viberate covers them. The data tells you who is moving; it never reaches the artist for you.
A and R has quietly turned into a reading problem. Roughly 100,000 tracks are uploaded to Spotify every day, and 86 percent of the 184 million tracks streamed in 2023 picked up fewer than 1,000 streams. Nobody scouts that volume by ear anymore. Every label, from a major down to a two-person indie, now leans on a music data tool to shrink the pile to a shortlist it can actually listen to.
The trap is that the tool does not decide what matters. You do. Most dashboards open on the biggest numbers they have: followers, monthly listeners, total streams. Those are the easiest numbers to display and the worst numbers to sign on. They describe the past, they can be inflated by one lucky playlist placement, and they say little about whether the audience is growing on its own. A label that ranks its watchlist by size ends up chasing artists who already peaked, at the price of an artist who is about to.
The standard has also moved underneath the tools. Labels in 2026 want proof that an audience already exists rather than a promise that one might. As former Atlantic A and R president Pete Ganbarg put it, the audience has already voted. That makes the data more important, not less, but only if you are reading the votes that count. A seat on a good analytics platform with the wrong metric on the front page is an expensive way to be confidently late.
The fix is a signal hierarchy: decide in advance which numbers lead and which ones only confirm, then set your tool up to show you the leaders first.
Acceleration beats size. The 2026 A and R tool landscape weights short-form sound velocity over a 7 to 14 day window first, then Discover Weekly add-rate and save-to-stream ratio. What those have in common is that they measure change, not accumulation. A small artist whose saves are climbing week over week is a better lead than a large one whose totals are flat.
Engagement beats reach. A save, a playlist add, or a full listen is a decision a listener made. A stream from an autoplay queue is not. An analysis of billions of streaming plays found 24.14 percent of songs were skipped within the first 5 seconds and 28.97 percent within the first 10, which is why completion and saves say more about a record than a raw play count does.
Agreement across platforms beats a single spike. Real momentum shows up in more than one place. The same tools compare the Spotify-to-Apple Music ratio for exactly this reason: a number that only moves on one surface deserves a second look before it earns a meeting.
You do not need a major-label budget to read any of this. Chartmetric runs 117 dollars a month for Premium and 150 for Ultra, and Viberate Analytics is about 19.90 dollars a month with a Signed to a Label filter that isolates unsigned artists. In a Viberate survey of 125 music professionals, most of them label managers and A and Rs, Spotify, YouTube and SoundCloud ranked as the most important discovery surfaces, and those are exactly the surfaces these tools read.
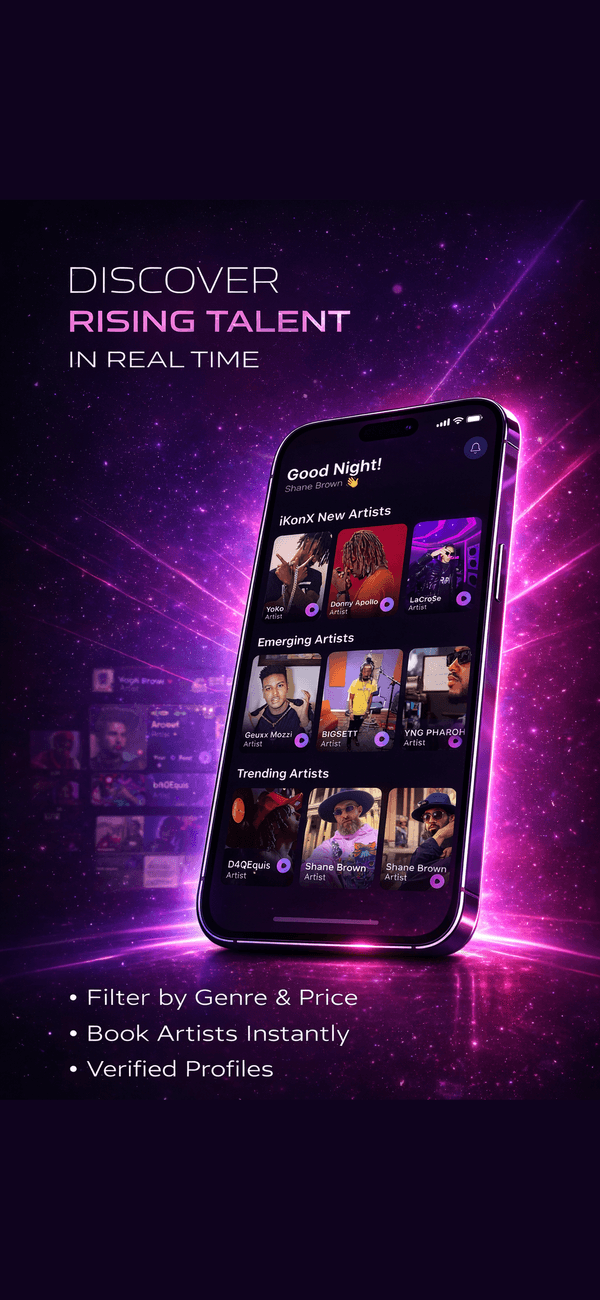
What no data tool does is the last step. It hands you a name and a curve, then leaves you to find a manager, a distributor contact, or a DM that may never be read. That gap is what iKonX is building a Labels side to close: verified unsigned artists you can find and message directly, with no gatekeeper in between. When a deal involves a service the artist sells, the artist keeps 100 percent of the price they set, iKonX takes 0 percent platform commission, and the buyer pays a flat 10 percent on top. iKonX is free to download and explore, and full access to paid features is a flat 9.99 dollars a month. To be straight about where we are: the Labels side is on the roadmap, not a finished A and R suite, and it is not a forecasting engine. Use a data tool to read the signal, and use iKonX for the conversation.
How to set up a music data workflow for A and R
- Write the question before you open the tool. Which genre, which career stage, which territory, and what you can realistically offer. A watchlist without a question fills up with whatever the dashboard ranks highest, which is usually whoever is already big.
- Pick one tracker and learn it properly. Chartmetric at 117 or 150 dollars a month and Viberate at about 19.90 cover the core signals. One tool you read fluently beats three trials you never open, and the cheaper seat with an unsigned filter is often enough for a small label.
- Set the front page to acceleration. Sort on change over a 7 to 14 day window, not on totals. Put short-form sound velocity, save-to-stream ratio and playlist add-rate where you see them first, and move follower counts to the confirmation column.
- Demand agreement across platforms. Before a name goes on the shortlist, check that the movement shows up on more than one surface. One spike on one platform is a question. The same climb on streaming, short-form and search is a lead.
- Listen before you trust the curve. Data narrows the pile; it does not replace your ears. Play the record from the top the way a listener would. If you would skip it in the first ten seconds, a lot of listeners probably already have.
- Reach the artist while the signal is fresh. Acceleration is a head start that expires. Message the artist directly, reference the exact signal you saw, and put fair terms in writing. That direct contact is the step iKonX is building its Labels side around.
Filter the deck to artists at the same rung as your label, so a signing fits where you are now, not where you wish you were.
No demo pile, no inbox gatekeeper. You contact a verified profile straight from the deck and start the conversation on your terms.
The A and R metrics that matter, and the trap in each
| Metric | What it tells you | Where to read it | The trap |
|---|---|---|---|
| Short-form sound velocity (7 to 14 days) | Whether a song is spreading right now | Chartmetric, Viberate, TikTok itself | One viral clip is not a fanbase; check it carries to streaming |
| Save-to-stream ratio | Whether listeners want the record again | Cross-platform trackers | Small sample sizes swing wildly; wait for volume |
| Playlist and Discover Weekly add-rate | Whether algorithms and curators are picking it up | Chartmetric, Viberate | One large editorial add can dwarf organic growth |
| Spotify-to-Apple Music ratio | Whether the audience exists beyond one platform | Cross-platform trackers | Genre and territory shift the normal range |
| Skip and completion | Whether the opening holds a listener | Your own ears, artist-shared data | Hard to see from outside; listen from the top |
| Followers and monthly listeners | How big the artist already is | Every dashboard | Describes the past; the easiest number to over-weight |
| Direct contact (iKonX, roadmap) | Whether you can reach the artist this week | iKonX Labels side, in development | Not a metric; it is the step the data tools leave to you |
Metric weightings and figures are dated and sourced. The 2026 A and R tool landscape, including roughly 100,000 daily uploads and signal weighting led by short-form sound velocity over a 7 to 14 day window, Discover Weekly add-rate, save-to-stream ratio and the Spotify-to-Apple Music ratio (chartlex.com, 2026). 86 percent of the 184 million tracks streamed in 2023 got under 1,000 streams (thembj.org, 2024-11-19). Chartmetric Premium 117 dollars a month and Ultra 150 (chartmetric.com, verified 2026-06-01); Viberate Analytics about 19.90 dollars a month with a Signed to a Label filter (viberate.com, 2026-06-02); the Viberate survey of 125 music professionals (viberate.com, 2025); skip rates from an analysis of billions of streaming plays (musicmachinery.com, 2014-05-02, older data, directional only); labels seeking proof of audience traction (thatericalper.com, 2026-04-01). The trap column is editorial practice, not a measured study. Verify tool prices at the source before you buy. The only fixed claim here is the iKonX model: the artist keeps 100 percent of the price they set, iKonX takes 0 percent platform commission, and the buyer pays a flat 10 percent on top. iKonX is free to download and explore, full access to paid features is a flat 9.99 dollars a month, and the only payout deduction is a low, sub-5% withdrawal fee, below the industry standard.
Music data tools for A&R: FAQ
What music data tools do A and R teams use?
Working A and R teams mostly use cross-platform analytics trackers such as Chartmetric and Viberate, alongside the discovery surfaces those tools read: Spotify, YouTube and SoundCloud, which a Viberate survey of 125 music professionals ranked as the most important. The major labels also run proprietary engines internally, but a small label can read the same public signals with one affordable seat.
Which metric best predicts that an artist is about to break?
No single metric does, but acceleration signals lead. The 2026 tool landscape weights short-form sound velocity over a 7 to 14 day window first, then playlist add-rate and save-to-stream ratio. The strongest leads show the same climb on more than one platform. Follower counts and monthly listeners are better at confirming size than at predicting growth.
Are follower counts useless for A and R?
Not useless, just late. Followers and monthly listeners tell you how big an artist already is, which matters for deal size and risk. They are poor at telling you who is about to grow, because they accumulate slowly and one large playlist placement can inflate them. Read them as confirmation after an acceleration signal, not as the thing you sort on.
How much do music data tools for A and R cost?
Chartmetric runs 117 dollars a month for Premium and 150 for Ultra, and Viberate Analytics is about 19.90 dollars a month with a filter that isolates unsigned artists. The discovery surfaces themselves, Spotify, YouTube and SoundCloud, are free to browse. Prices change, so verify at the source before you commit to a year.
Where does iKonX fit in an A and R data workflow?
iKonX is building a Labels side for the step no data tool takes: reaching the artist. A tracker hands you a name and a curve; on iKonX you will be able to find verified unsigned artists and message them directly, with no gatekeeper in between. It is on the roadmap, not a forecasting engine, so pair it with the tracker you already read. The model is artist-first: the artist keeps 100 percent of the price they set, iKonX takes 0 percent platform commission, and the buyer pays a flat 10 percent on top. iKonX is free to download and explore, full access to paid features is a flat 9.99 dollars a month, and the only payout deduction is a low, sub-5% withdrawal fee, below the industry standard.
Labels is coming to The Network
Scouting opens soon. Be first to the deck when it goes live · no pressure, just a seat held.
Explore the connected sides of the network
Find the talent first. Sign on your terms.
iKonX is building a Labels side where you find verified unsigned artists and reach them directly. Artists keep 100 percent of the price they set, and iKonX takes 0 percent commission.
DOWNLOAD THE FREE PDF TODAY:
The Indie Label A&R Scouting Playbook
A modern A&R checklist for finding, career-stage-matching, and signing unsigned artists in 2026.
Get the free PDF ->